We made our AI analyst declare its evidence sources in every management report. The split surprised even us.
The Setup
We ran an integrated CEO + CMO weekly review for a German sports retailer — one AI analyst, one prompt, live SQL against the data warehouse via MCP. No canned numbers, no summaries prepared by humans.
Two rules in the prompt do the heavy lifting:
Every answer must end with an estimate: what share of the conclusions and recommendations came from (a) the AI model’s own knowledge, (b) internal brand data, (c) the brand panel, (d) the wider market. Four numbers, summing to 100%.
Every finding must be classified: proven cause, effect, correlation, or unexplained. Correlations are reported separately and never upgraded to causes without arithmetic proof.
The split
Here is what the footer reported:
| Source | Share | What it actually contributed |
|---|---|---|
| AI model alone | 5% | Methodology, KPI logic, report structure. Static market behaviour, zero business numbers. |
| Internal brand data | 55% | Marketing, journeys, sales, profit — the scorecard, an exact profit bridge, every driver. |
| Brand panel (70 brands) | 20% | What the market around the brand (suppliers, partners, competitors, surrogates) actually did. |
| Wider market (500 more brands) | 20% | Audience shifts across the market — the “why” and the “what’s next”. |
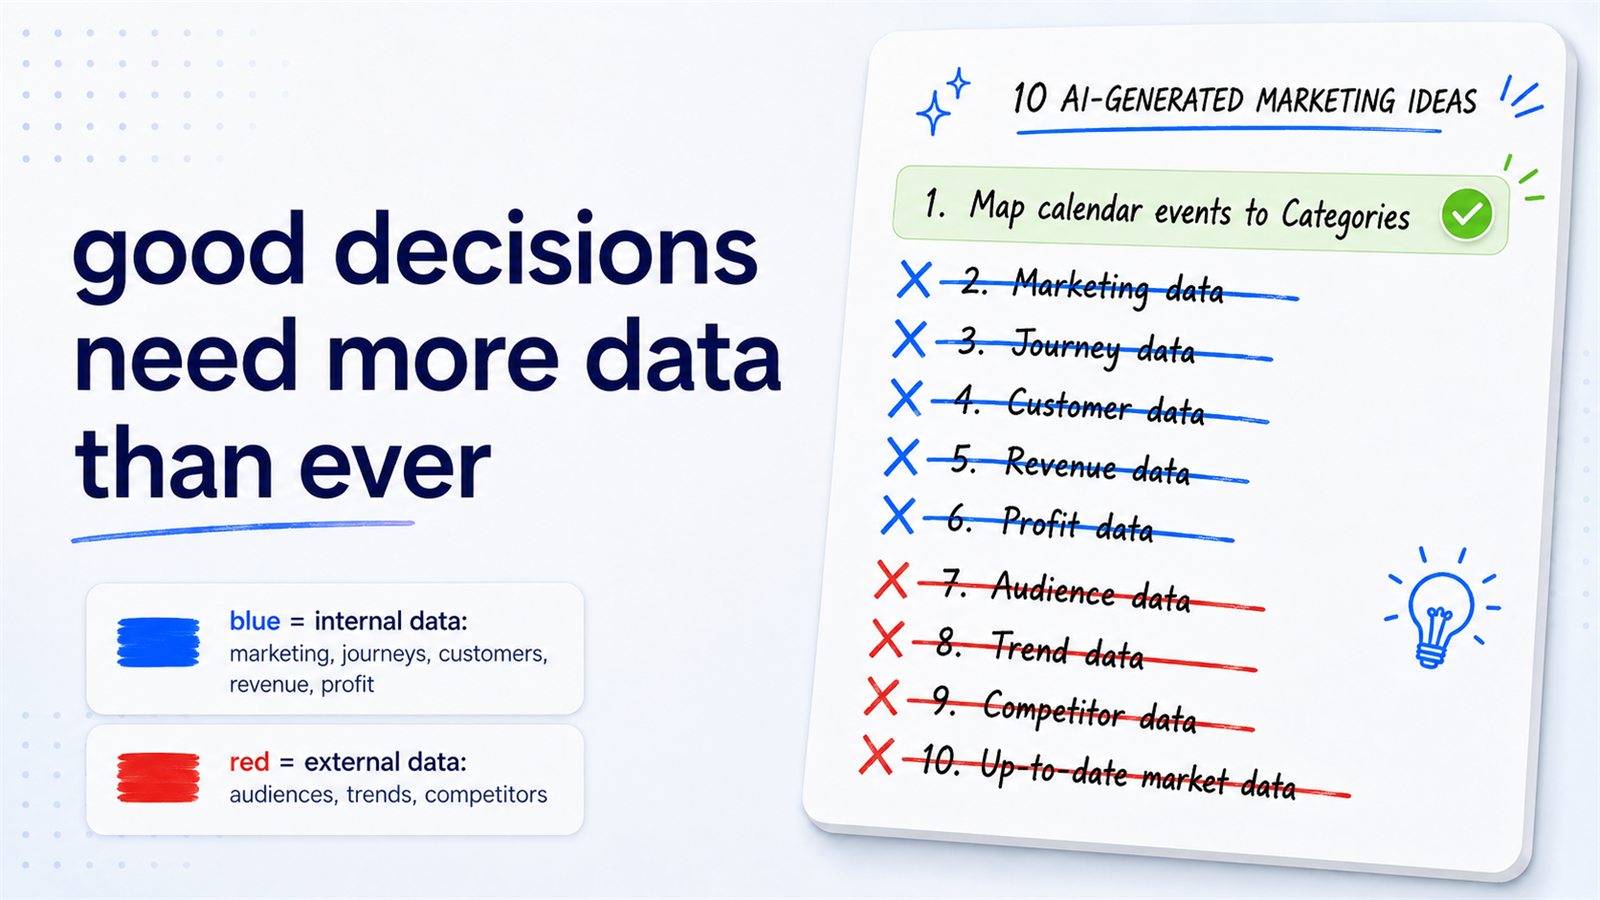
AI model + internal data accounts for only 60% of total relevance.
Why the 60% ceiling matters for BI teams
The internal 55% is the part BI teams already own — and in this run it delivered the strongest single result: a profit-contribution bridge that reconciles to the cent. When the semantic layer is clean, the AI’s profit statement is arithmetic, not narrative.
But three of the most decision-relevant findings were invisible from inside the warehouse:
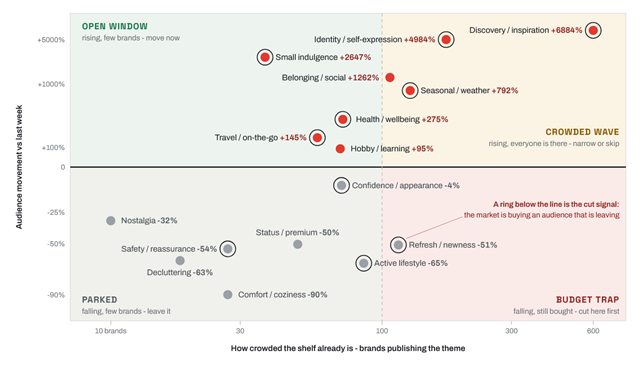
A conversion collapse looked like a traffic problem — until journey data exposed a tracking artefact inflating volume, and market data showed audiences rotating away from exactly the content class the brand was funding. Internal data found the what; market data delivered the why.
The promo climate had flipped — competitors pulled discount pushes to near zero in a week that was the discount peak twelve months earlier. No internal table contains that fact.
The next two weeks were plannable — season-start events and a weather window turned two declining categories from “problem” into “timed opportunity”. Forward-looking by construction; a DWH is backward-looking by construction.
That is the missing 40%: it is not more of the same data. It is a different kind of data — and it changes recommendations, not just context.
The architecture point
None of this required a second platform. The market layer sits as governed views in the same schema as the sales and marketing marts, with table and column comments the AI reads before querying.
One MCP connection, one SQL dialect, one KPI vocabulary — which is precisely why the AI can put an internal number and a market number in the same sentence and classify the relationship between them.
→ Read the full post: AI on autopilot — what happened when we measured it
See your missing 40%.
Talk to us and we'll show you what your AI and your warehouse can't see: the market layer, as governed views next to your sales and marketing marts.
Speak with an Expert → Subscribe on LinkedIn