If you manage or advise growth, you’ve likely seen this movie before: The marketing dashboard shows a beautiful, healthy platform ROAS. Conversion tracking looks optimized to the millimeter. Yet, overall business revenue growth is flattening out.
This is the platform ROAS trap — and it’s hiding the market that is currently sitting right outside your radar.
The Blind Spot of “Inside-Out” Optimization
Traditional performance marketing treats social channels like a closed digital vending machine: you drop a dollar in transactional product ads, you track a direct last-click action, and you count the revenue conversion.
It feels safe. It feels measurable. But it is fundamentally limited.
ROAS, CPA, conversion rate — every conversion metric shares the same flaw: it only measures the demand your campaigns actually touched. The person who saw your ad and bought. The person who clicked and didn’t.
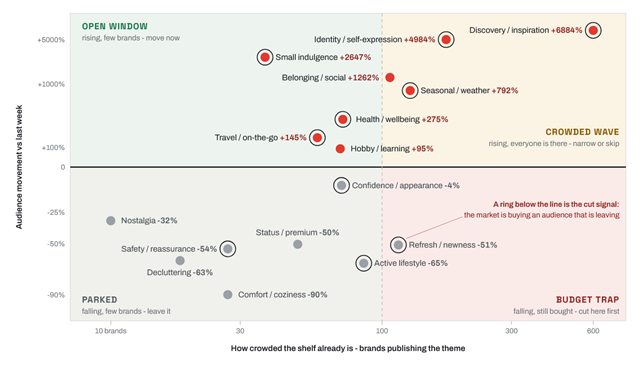
But the far larger group — the people in your market who never saw a single creative, never had the chance to convert — doesn’t appear anywhere in your dashboard.
Conversion metrics have no denominator.
The trap: growing against yourself
Here is how the trap works in practice. A retailer closes the year at +15% social-attributed revenue. The team celebrates. The budget gets renewed.
Meanwhile the market in their core categories grew +18%.
They didn’t grow. They shrank — in the currency that matters: market share and relevance to the business audience!
And no amount of ROAS optimization would have shown it, because every KPI benchmarks against its own history, never against the market it operates in.
We see this pattern again and again. In a recent analysis for a premium retailer, the segments holding 80% of audience interest generated only ~17% of their revenue. Their social marketing was efficient — beautifully efficient — at converting the narrow slice of demand it addressed. It was simply limited to 20% of the market.
That is the difference between a conversion problem and an opportunity.
Almost every retailer is solving the first while bleeding from the second.
“How much of the available market opportunity did we actually capture?”
The enhanced approach: steer on opportunity + revenue
The fix is not another attribution model. It is adding the missing dimension to the target system: steer social marketing on opportunity capture and revenue conversion together, not on conversion alone.
The whole logic compresses into one formula for missed revenue:
MR = M · MG · η
- M
- market demand per category segment: what the addressable market actually spends, not what you currently reach
- MG
- market growth: how fast that demand is expanding (or contracting)
- η
- your capture efficiency: how well you convert the demand your campaigns do touch
Your ROAS stack measures η. Only η.
M and MG — the two factors that determine whether your efficiency is applied to a growing goldmine or a shrinking niche — are invisible to it.
A brilliant η on a tiny, stagnating M is how retailers optimize themselves with green dashboards all the way down.
What this means for social campaigns
In practice, every social campaign gets a dual mandate with two distinct KPI sets:
The opportunity side. What share of the high-demand segments in your market do your campaigns actually address? Which segments show strong audience relevance and competitor activity — but zero presence from you? Budget allocation follows a scored gap matrix of the market, not last quarter’s internal ROAS ranking.
The revenue side. For the demand you do reach: own attribution logic in your own data warehouse. Apply margin and new-customer weighting, and incrementality checks.
The sequence matters: opportunity first, conversion second.
First decide where to point the budget based on market demand. Then measure how well you convert.
Most retailers run this exactly backwards — they let conversion data decide where the budget goes, which systematically reinvests in the segments they already own and starves the ones where the growth sits.
What changes on Monday morning
Three shifts, none of which require touching your creative or your media buying:
First, add a market denominator to every social KPI. “+15% YoY” is not a result; “+15% in a market growing +18%” is.
Second, build the gap matrix: market demand per segment × your current campaign presence per segment. The empty cells with high demand are your cheapest growth — demand that already exists and merely needs to be addressed.
Third, split your targets. One coverage KPI, one conversion KPI, per campaign. If a campaign can only report on the second, it is flying blind on the first.
The Market Outside Your Radar — because the biggest revenue opportunity is, by definition, the one you can’t see.
Want to see your own gap?
We run a free gap snapshot for your brand: your market's demand distribution across segments versus your current marketing footprint — one page, no pitch.
Speak with an Expert → Subscribe on LinkedIn